CDT — Customer Decision Tree UI Redesign
Redesigning a complex data visualisation during a platform re-architecture
When I joined dunnhumby, one of my first projects was designing a new UI for the Customer Decision Tree (CDT) — a core data visualisation that helped retail category managers understand shopper behaviour across product categories.
The product was undergoing a complete re-platform because Flash was being decommissioned in December 2020. Rather than simply rebuilding what existed, the team used this as an opportunity to involve UX and UI from the very beginning — to rethink the experience from scratch, not just port it across.
A hierarchical data structure with complex interaction states
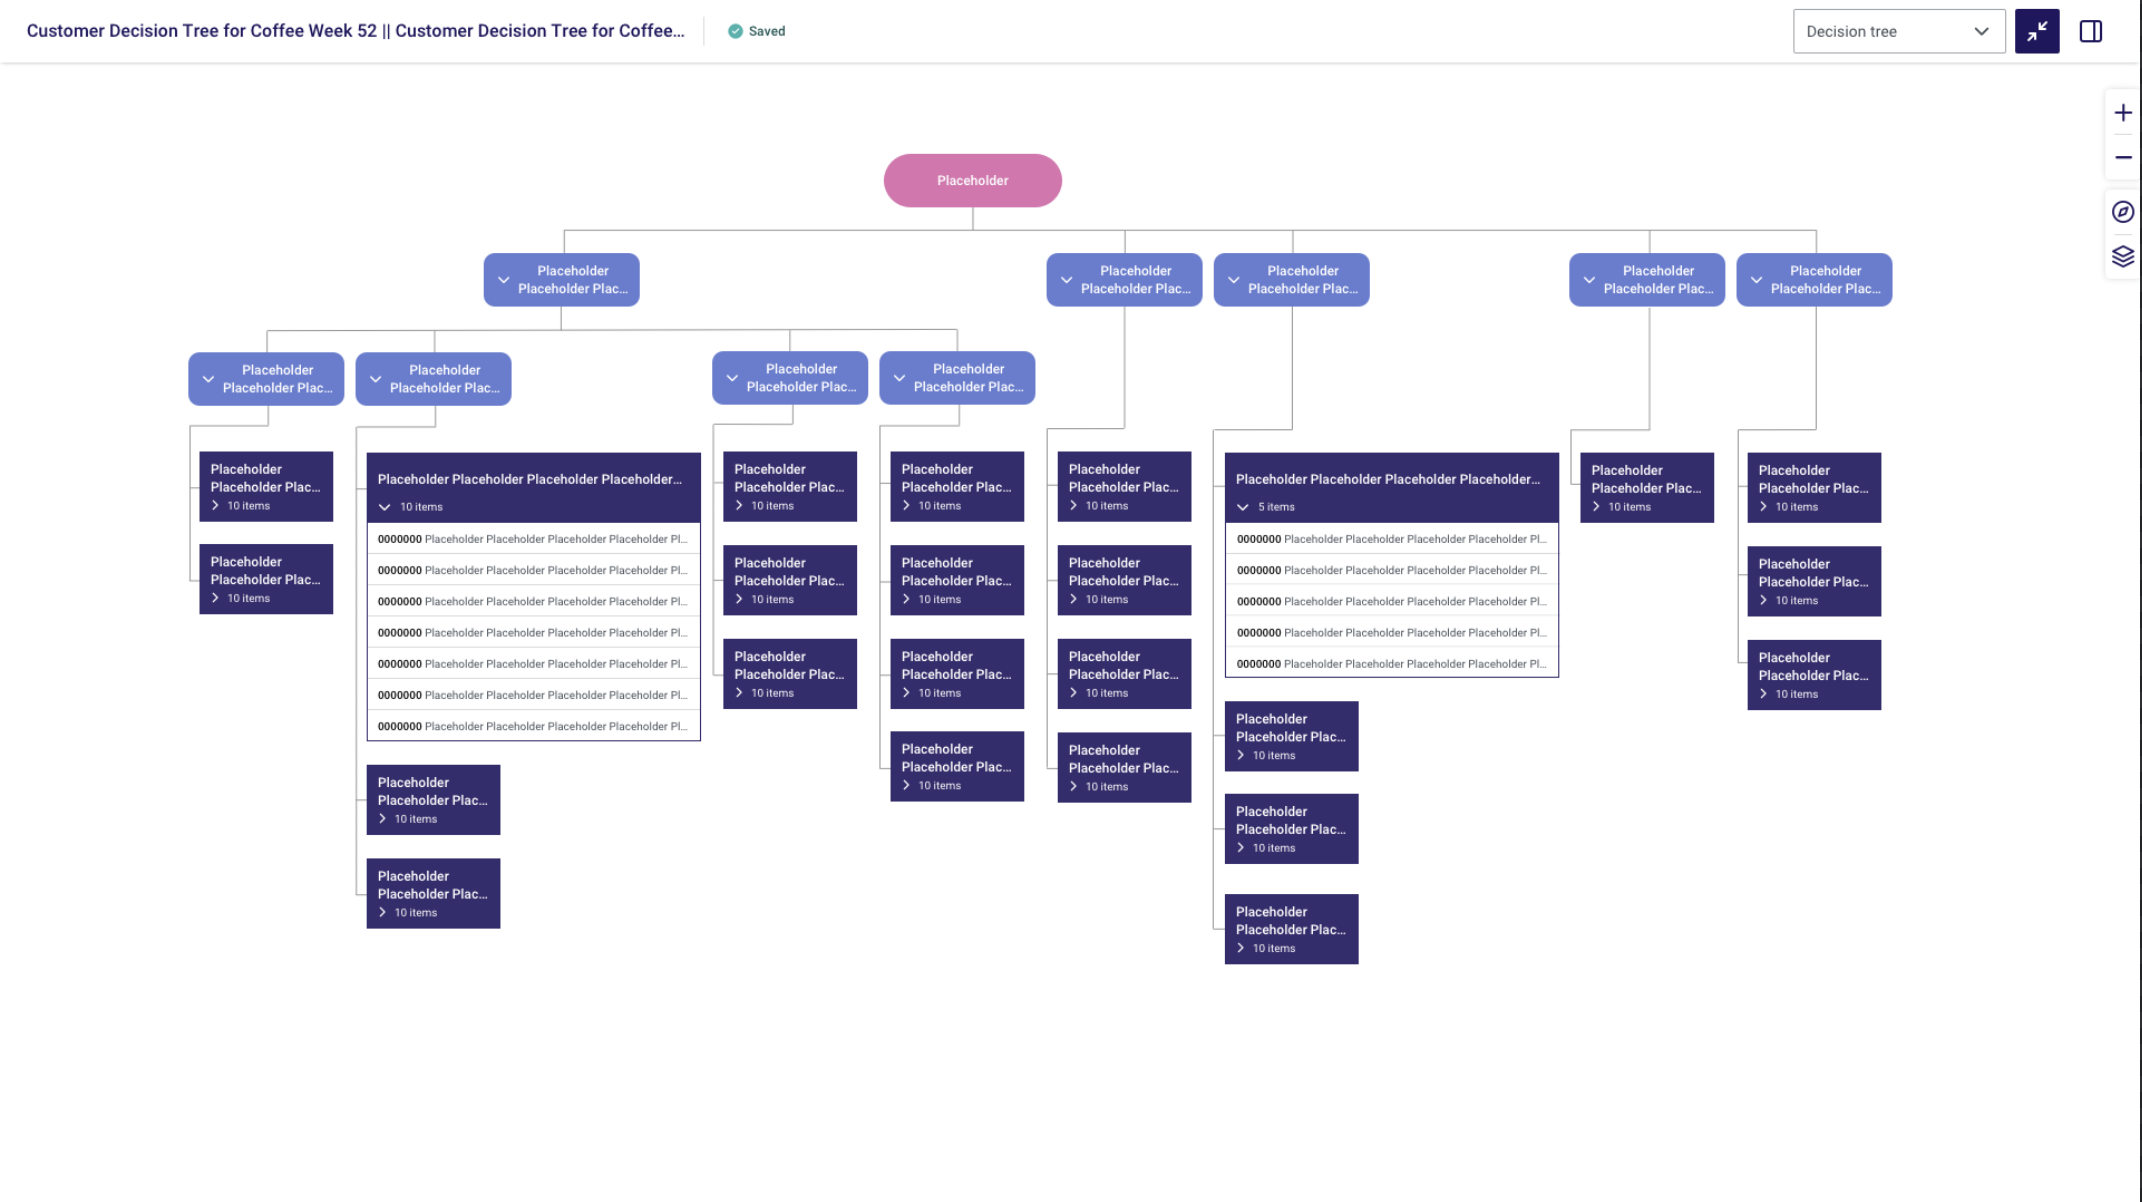
The CDT allowed users to group products into different "buckets" determined by shopper behaviour. Similar products were grouped together to show relationships with one another — the top of the tree represented the category as a whole, with increasingly granular groupings further down.
There were three tiers of groupings: the root (1st level), the decision nodes (2nd level), and the need states (3rd level). Products were displayed in their relevant need states, and users could move products around the tree to regroup them.
My first action was to review the current tree design to understand the functionality — what components were needed, the interactivity of the UI states, and critically, who would be using this part of the product.
From early exploration to a validated final design
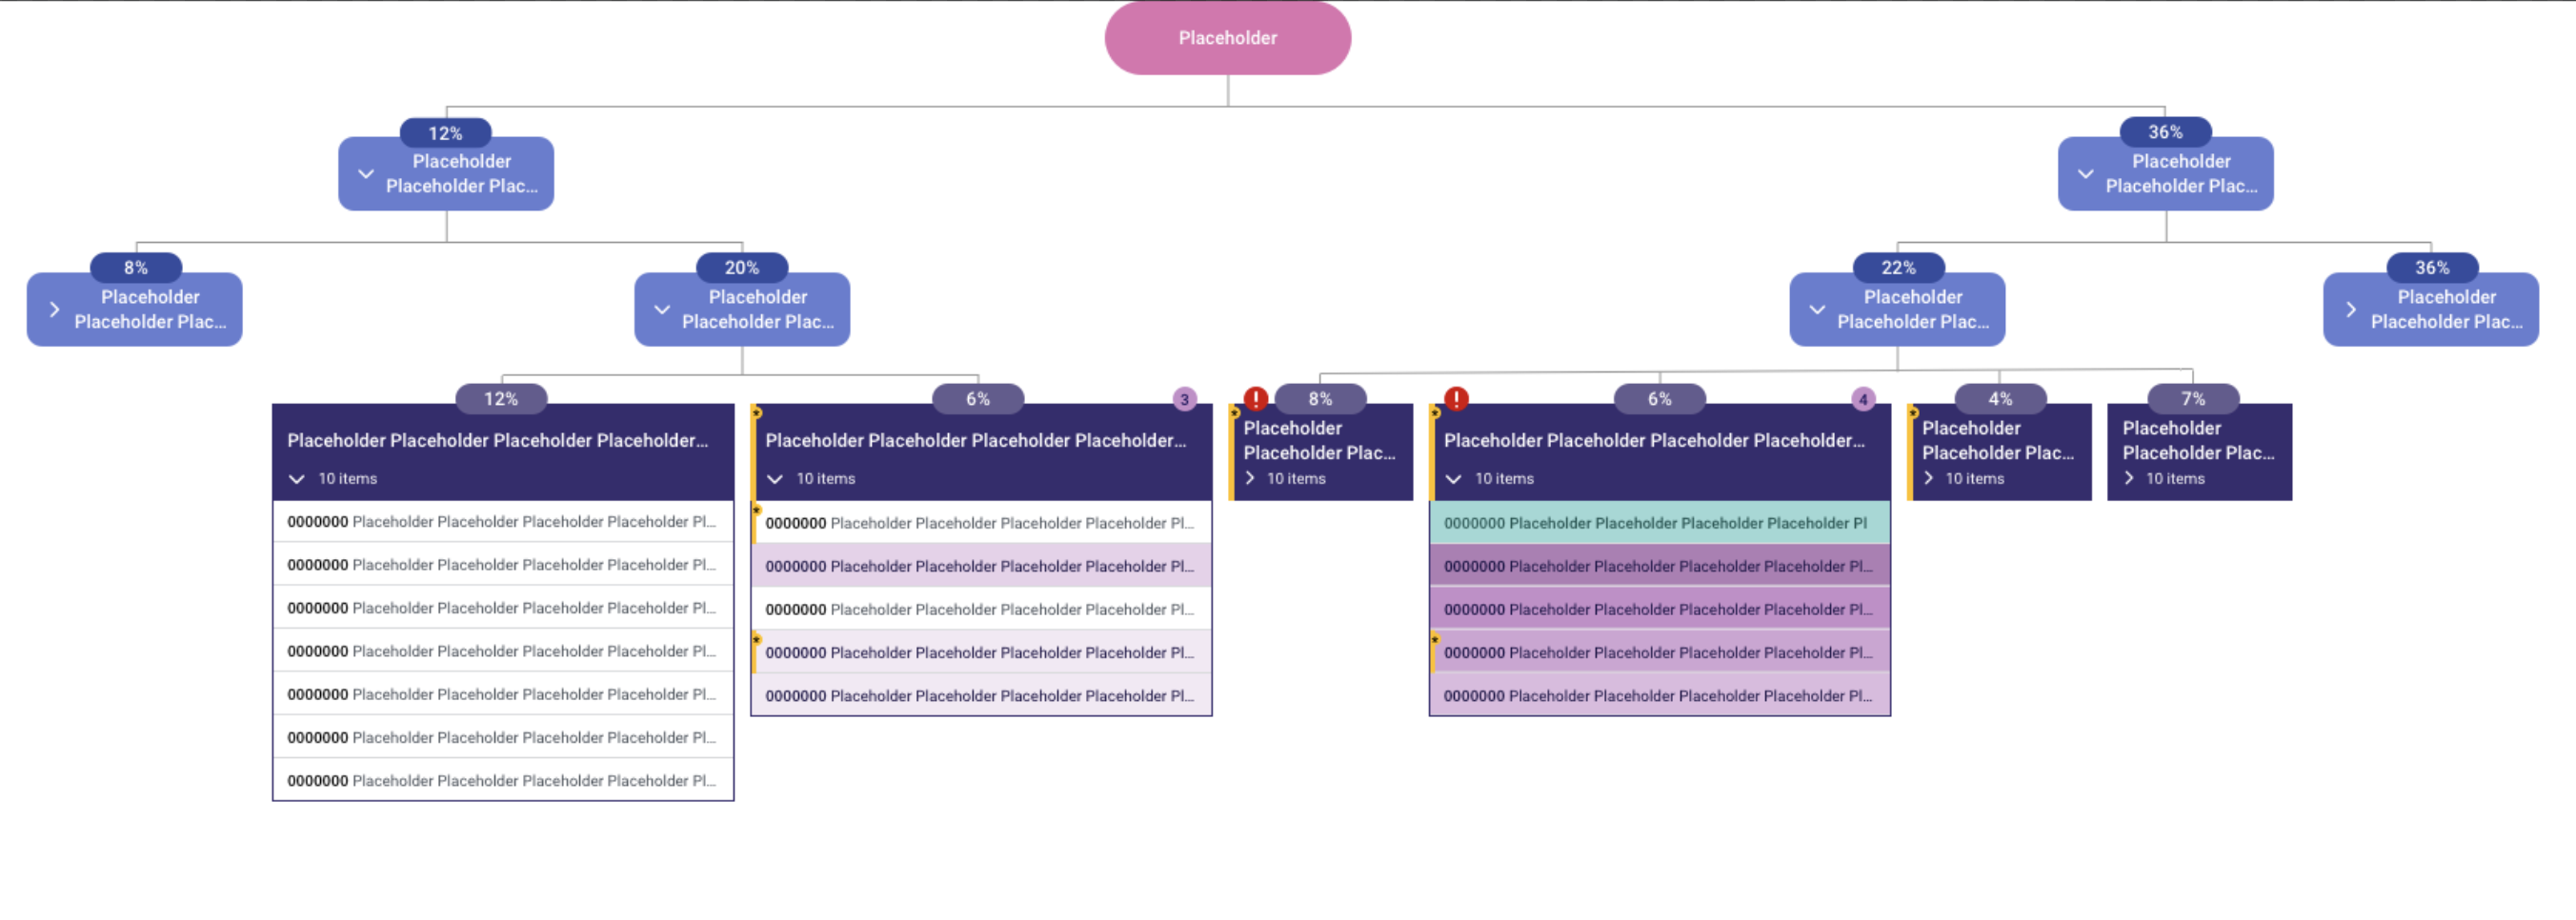
A modern, intuitive UI that users loved
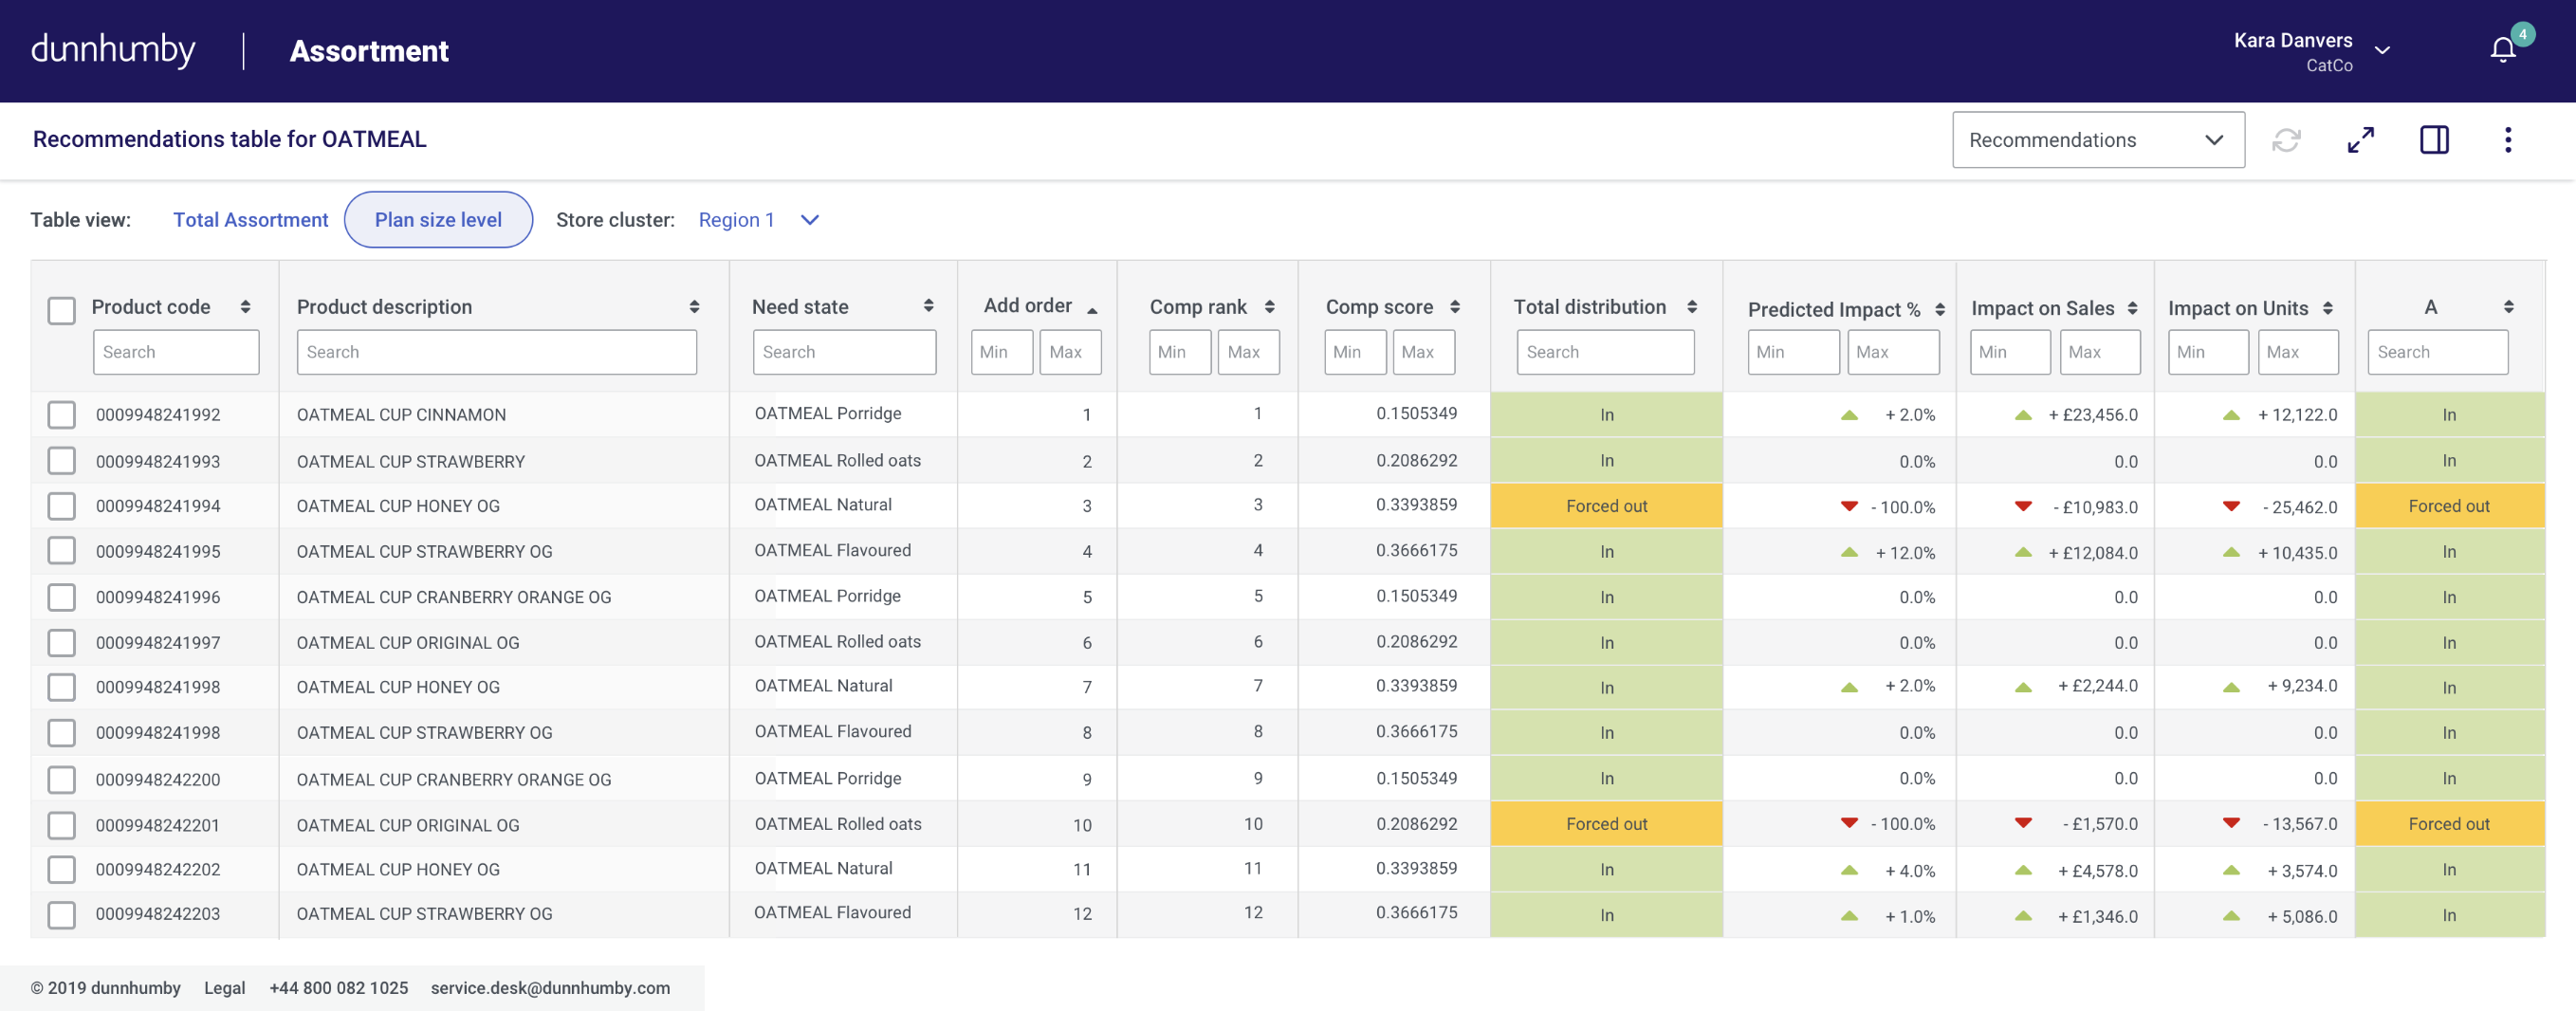
The final design not only met the full functional requirements and included all the relevant interactive states — it also received genuinely positive feedback from users, who found it far more intuitive than the legacy Flash tool and appreciated the modern look and feel.
"They found it much more intuitive to use and really appreciated the more modern UI."